In class last week we discussed the differences between distant reading and close reading and how they can complement each other as we analyze texts. Clearly the mass digitization of libraries and archives has given the reader access to previously under accessed resources. With tools such as Voyant a reader can now perform new ways of reading that we might title “distant” or “spatial” or even “accidental.” The goal of distant reading is not to provide an alternative to close reading, but rather to open up a new way of asking questions, come to surprising conclusions, to spark inquiry. As Johanna Drucker says, visualization is a procedure and not a product.
These distant reading tools invite us to play with texts in a way we have not been able to before. And despite the temptation to dismiss this play as trivial, many critics see visualization as an interface in an iterative process of play; as part of the process of problem-generating.
In the reading Whitley points out that literary criticism all too often rests its arguments on small amounts of data to make arguments that are then extrapolated into general observations. We call this reading syntagmatically. Distant reading however bases its readings on huge amounts of data that are read synthetically.
Spatial reading
Whitley argues that many literary scholars are less than skillful in their understanding of the cognition of reading; that is to say that the medium also is the message. Humans preview for shape when reading, we look for preconscious visual forms for to find more contextual information. We are always looking for patterns. Scatterplots of texts visualize the spatial clustering of terms. This is useful in looking for patterns of sentiment, for example. The phenomenology of such patterning may reveal even unconscious processes on the part of the author. This is how critics have been able to identify J.K. Rowling as the author of the recent crime novel that she published anonymously.
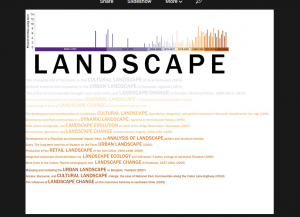
Tag clouds can reveal surprising things.
Now it’s your turn to experiment in preparation for submission of Blog Post #2 “On Distant Reading.”
Blog #2: “On Distant Reading” Due: 9/23
Context: From this point forward in the course you will engage in critical analysis as we experiment with each Digital Humanities approach. Critical analysis in this case involves articulating a research question, examining that research question using the DH approach that you have experimented with, and synthesizing from that experimentation two things:
Does this particular approach help you to answer your research question?
If it does (or if it leads you to unexpected and compelling new questions), what conclusions can you draw that you might not with more traditional humanistic means?
If the approach does not help you to address your research question, why not?
This week you have experimented with several text analysis visualization tools within the Voyant tool suite. Each tool “reveals” different things about a text – relationships between types of words, frequencies, etc.
In this blog post you are going to use the full compiled transcription of the Powell diary.
Historical perspective on an event can vary dramatically depending on a number of factors:
Was the person describing the event involved in the event itself and if involved, how so?
How much time was there between the event and the historical account?
Was there a particular bias in the sources used in studying the event?
To what degree was the experience a part of the author’s cultural heritage?
The Moravian missionaries are in Shamokin to proselytize. How would you use distant reading to answer the questions above? What dominant words in the January-April 1748 section of the Shamokin Diary reveal their purpose?
Include 3 visualizations of your own and refer to three points in the Whitley reading (due Tuesday 9/23 by 11pm). Post under category “distant reading” and blog #2.
——————————
Check out these projects using distant reading:
Inside Higher Ed
Geography dissertations and their titles:
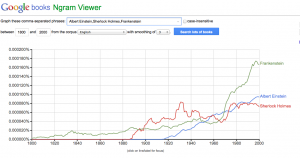
Google Ngram viewer: https://books.google.com/ngrams
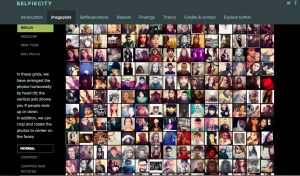
Massive data visualization project

