Throughout this course we have looked at several ways to organise information and present it in such a way that it is more meaningful than before. The creation of our very own GIS maps are a prime example of this. Bodenhammer emphasises the meaningfulness of maps by stating that “all spaces contain embedded stories based on what happened there” and that “each of them link geography (spaces) and history (time)”. This is what we are illustrating with our GIS maps; we are physically showing where things in history occurred and how the peoples of that time are connected geographically. The tools in GIS allow us to create layers which can represent different aspects of the story we are trying to tell. This is essential because if we were to put all our information onto one map in one single layer, it would be counterproductive and we wouldn’t learn anything from it. Therefore, it is most efficient to create several layers which coincidentally and conveniently mirror the complexity of the history which we are representing.
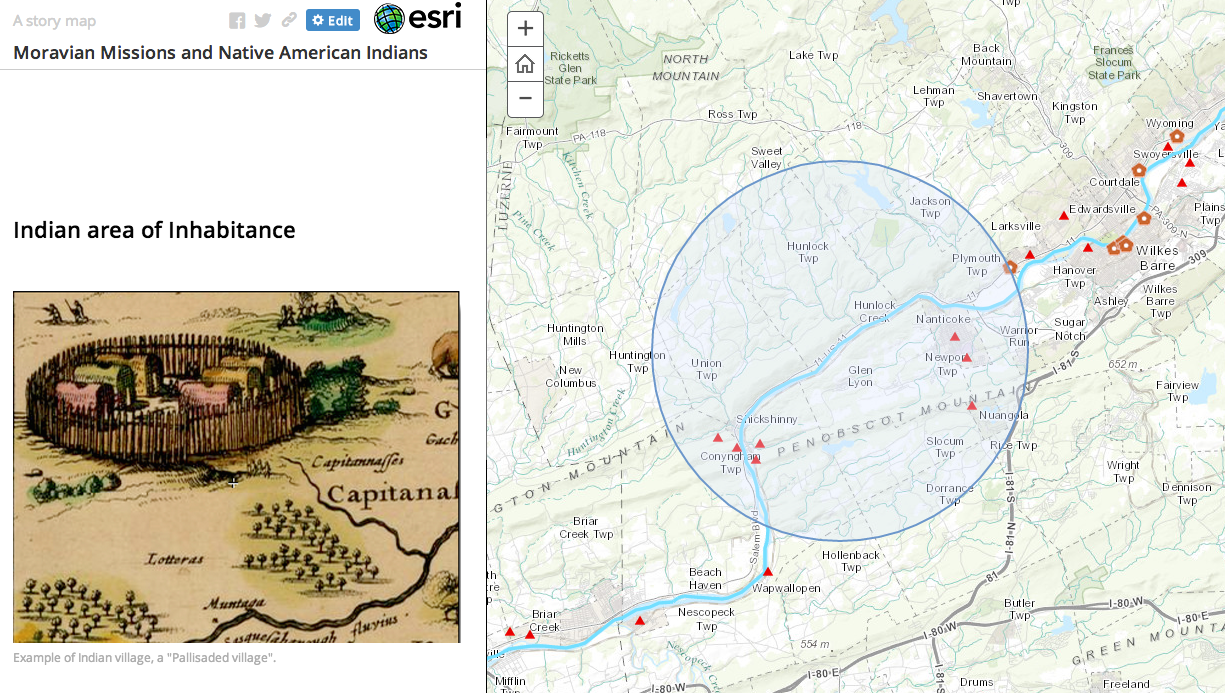
All of our GIS maps are based on the information that we obtained through the transcription and examination of the Powell Diary. In my case, I chose to represent a story that connects space, time and people. On the 11th of April 1748, Powell recorded that Mrs. Smith brought a group of Indians, who had traveled approximately 50miles down the North Branch of the Susquehanna River to Shamokin, to find the blacksmith. From one sentence, I was able to use GIS to represent all the places and people involved. Firstly, it was important that I measured the 50miles from Shamokin to approximate where the Indians came from (Picture 1). From an old map that was georectified, I was then able to mark out the path which the Indian’s most likely traveled. And finally, I indicated the location the Indian’s traveled to in order to find the blacksmith.
Just by completing the aforementioned tasks, GIS enable me to create a visualisation of an occurrence which that happened over 250 years ago. It demonstrates the paths Native American Indians used and alludes to the reasons that made them travel such vast distances. In essence, GIS provides us with “an alternate view of history and culture through the dynamic representation of memory and place”. The fusion of qualitative and quantitative data all in one map provides the viewer with an unique experience, an experience that connects them to a Moravian mission in 1748.
To take a closer look at my GIS map you can go to:
http://bucknell.maps.arcgis.com/apps/MapJournal/index.html?appid=089bee0cfa1746b7bf1893ce1613aa9f&webmap=1bcac85b4bec4a9fa7122d05ab83efc2&edit#