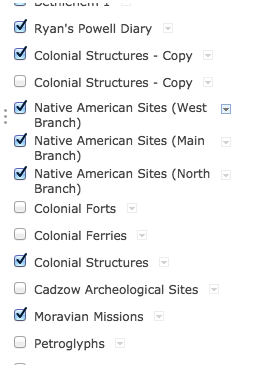
Throughout the week we’ve been learning about the various features of GIS and how we can take mapping and visual spatial thinking to the next level. Mapping has changed a lot over the years, and the “subject matter once organized largely by periods increasingly embraces themes of region, disapora, colonial territory, and contact zones and rubrics such as ‘border’ and ‘boundary’” (Bodenhamer 16). GIS encompasses all of these changes, and there are so many different options when it comes to adding layers or map notes, and in our case filtering through relevant data according to the Powell Diary. GIS is very impressive, and as Bodenhamer puts in “a magic box capable of wondrous feats, and the images it constructs so effortlessly appeal to us in ways more subtle and more powerful then words can” (Bodenhamer 17). Our maps that we created portray the journeys and specific landmarks mentioned in the Powell Diary, and we represented this with pins, trails and trading posts. Among the numerous trails that originally appeared on the map, I looked at the table feature in the drop-down menu of the Native American trails layer and identified which ones showed up in the Powell Diary. Yet, there was a lot more to learn that was originally on the map, and it was interesting to see how the Shamokin missions compared to those of other Native Americans’.
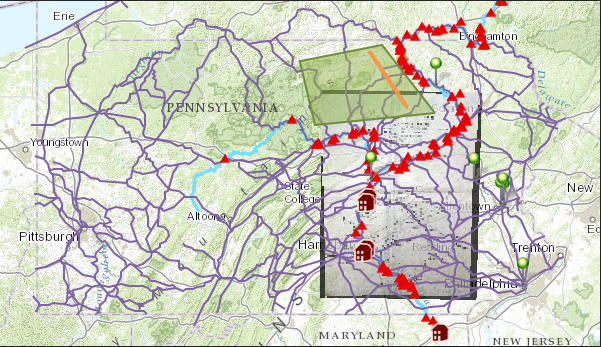
A lot of the paths and trails of the Native Americans and Colonialists intertwined with those of the Shamokins, as a lot of them crossed the same locations. The Susquehanna River served as a main reference point, and thus a lot of Native American sites were stationed along there. For my map, I turned off other colonial structures besides Trading Posts because they weren’t relevant but if I turned those layers back on then I would find a lot of ferries and forts located nearby. A lot of the areas that were mentioned in the Diary have been renamed, but when I turned on the different Georectified layers then I could see where all of the missions, Shamokin and non-Shamokin, really took place, which were mostly along the river. By reading the table in the Journeys layer, I discovered that a lot of the Native American missions were the same. GIS has allowed me to access a lot of information that is visually represented in a clear and comprehensible way that is readily accessible at one click of the mouse.
Mapping really makes it easy for us to see where and when important events took place. “All of the spaces contain embedded stories based on what has happened there” (Bodenhamer 16). They can show significant landmarks and the sequence of how they came to gain their reputation. Thanks to people who have recorded their whereabouts and the dates of them, we can follow what happened. Some of the names of the places have changed, but it isn’t difficult to see the evolution of them. There can be many ambiguities but websites like GIS help to visually distinguish between different components of maps.