This GIS, Geospatial Information System, is used to be able to describe the Moravian missions made by Powell and his friends during the year 1748. The GIS has already been used for similar ideas, shown in Bodenhammer’s article, The Spacial Humanities, “archeologists have used GIS and computer animations to reconstruct the Roman Forum, for example, creating a 3-D world that allows users to walk through buildings that no longer exist, except for ruins.” The Powell Diary, our main primary
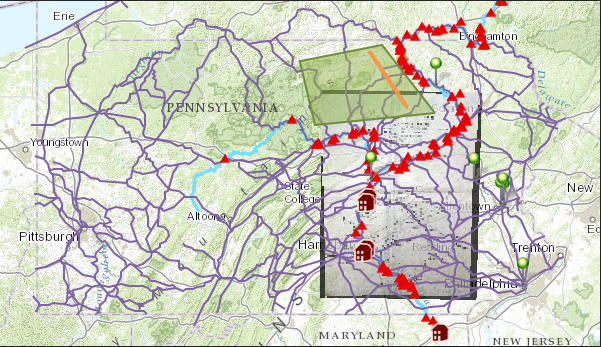
source, is used for contextual reading and close reading to show the relationship between people and other people and certain locations. The Powell Diary was then later used to extract important information and research to draw out and show how the missions interacted with each other. As seen on Ryan’s map, there were plenty of other paths and missions used during this time where Colonists and Native Americans interacted but not all of them were expressed or talked about during the Powell Diary. With the Powell diary limiting what we could show and talk about since there were limited pages covered, the maps that Ryan and John showed were very in depth. The paths were usually either direct routes to certain important cities or the quickest paths around geographical structures, such as valleys or mountains. Also, the paths were usually on or around creeks or bodies of water. Bodenhammer writes this concept of visualization accurately when he states, “..but [with] new powerful computers and emergent demand from such widely
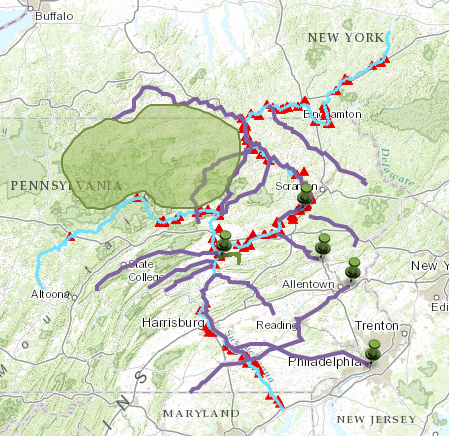
distributed fields as environmental science, landscape architecture, and urban planning that prized its ability to overlay data on a map of the earth’s surface,” showing that this technology was interesting, useful and necessary at the time of its arrival. This is because at the time, there wasn’t a great way to grow anything without being directly near water. John’s map is less clustered than Ryan’s, which doesn’t make it better, but more precise to the Powell Diary and the life around the town of Shomokin. This map would not have been able to be completed without the work done by Professor Faull and her two students over the summer, creating the map layers and the lessons to teach her students. The GIS software can easily display the connectedness between Native Americans and Colonist missions. This is shown not only visually on a map of the specific area described, but it is described verbally in the details and the explanations in each event, location, path, port city or any other marked object. This relationship is shown beautifully in the Bodenhammer article, “they all reflect the values and cultural codes present in the carious political and social arrangements that provide structure to society”.