When looking at historical events and texts, “graphical representation is among our most important tools for organizing information.” (Grafton) According to Grafton, people have used graphical representations for centuries. With applications such as TimeGlider and TimeMapper, viewers can not only get a better sense of when each event occurred, but can also get a better grasp and understanding of the topic at hand. Without the use of graphical illustrations, trying to get a grasp of the chronology of a series of events would be very difficult and disorganized.
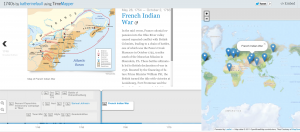
TimeGlider is personally my favorite graphical illustration application. With the use of TimeGlider, one can put a series of events in chronological order and also can view a brief description of each event. This is very useful because with this graphical illustration one can see the causes and effects that certain events had on other events. In addition, TimeMapper allows the user to implement the exact geographical location of where each event took place. This is one of the most

beneficial components of TimeMapper because it gives viewers a sense of where the event took place and also when it took place. In the illustration on the right one can clearly see a brief description of the selected event while also being able to view the location of the event as well.
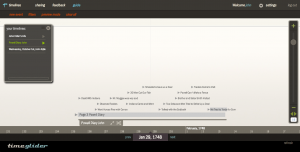
Although I am a fan of the TimeMapper, I also think TimeGlider is a very useful tool to chronologically order certain events. With TimeGlider one can see how certain events led to other events while also allowing one to get a
 better understanding of events chronologically. In the depiction on the left, one can view a well laid out chronology of events, and gain a better understanding of the Powell Diary content.
Although these applications allow one to clearly understand the order of historical events, according to Hayden White despite the cultural importance of chronology, it has been difficult to induce Western historians to think of it as more than a rudimentary form of historiography.