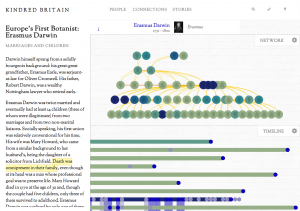
The Digital Humanities Project Kindred Britain uses the approach of network analysis to show how historic figures, mainly from Britain, were affiliated and related to one another. Although a network analysis project, Kindred Britain employs several other approaches such as mapping and visualization to help clearly convey the relationship of over 30,000 historic figures. 
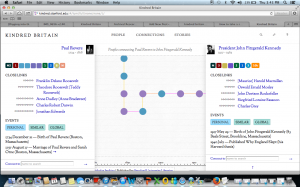
Through the collection of archives, documents, and other sources Stanford University was able to not only give an in depth biography of over 30,000 historical figures, but was also able to show each figures relationship with one another. With this extensive database, Stanford University was also able to give an accurate historical timeline of many figures while also providing viewers with an extensive family tree of each historical figure. In this blog I will examine how Paul Revere, one of the most iconic figures in the Revolutionary War, was related to President John F. Kennedy. By dragging Paul Revere’s icon on top of President John F. Kennedy, Kindred Britain takes the user into a separate timeline that shows how Paul Revere’s mutual friends connect him to President John F. Kennedy and his connections.
Before looking at the two figures mutual connections, both of the figures bio’s show up on the screen. In a very clear and well laid out tab, one can view both Paul Revere’s close connections, his occupation as a craftsman and American Revolutionary leader, and pivotal events that he played a role in such as his famous Midnight Ride on the night of April 18. On the other side, one can also easily view President Kennedy close links (John Rockefeller, Oswald Mosley), when he took his oath into office, and the day he was assassinated. In the image to the right you can see that each circle represents a historical figure that is related to both President Kennedy and Paul Revere in some way. The purple icon represents a woman while the blue icon represents a male. I highly recommend this site for anyone who wants to learn about history and each historical figures relationships with one another. Because of the extensive data, the use of visualization and network analysis to convey the subject topic proved to easiest and best way to convey the information.