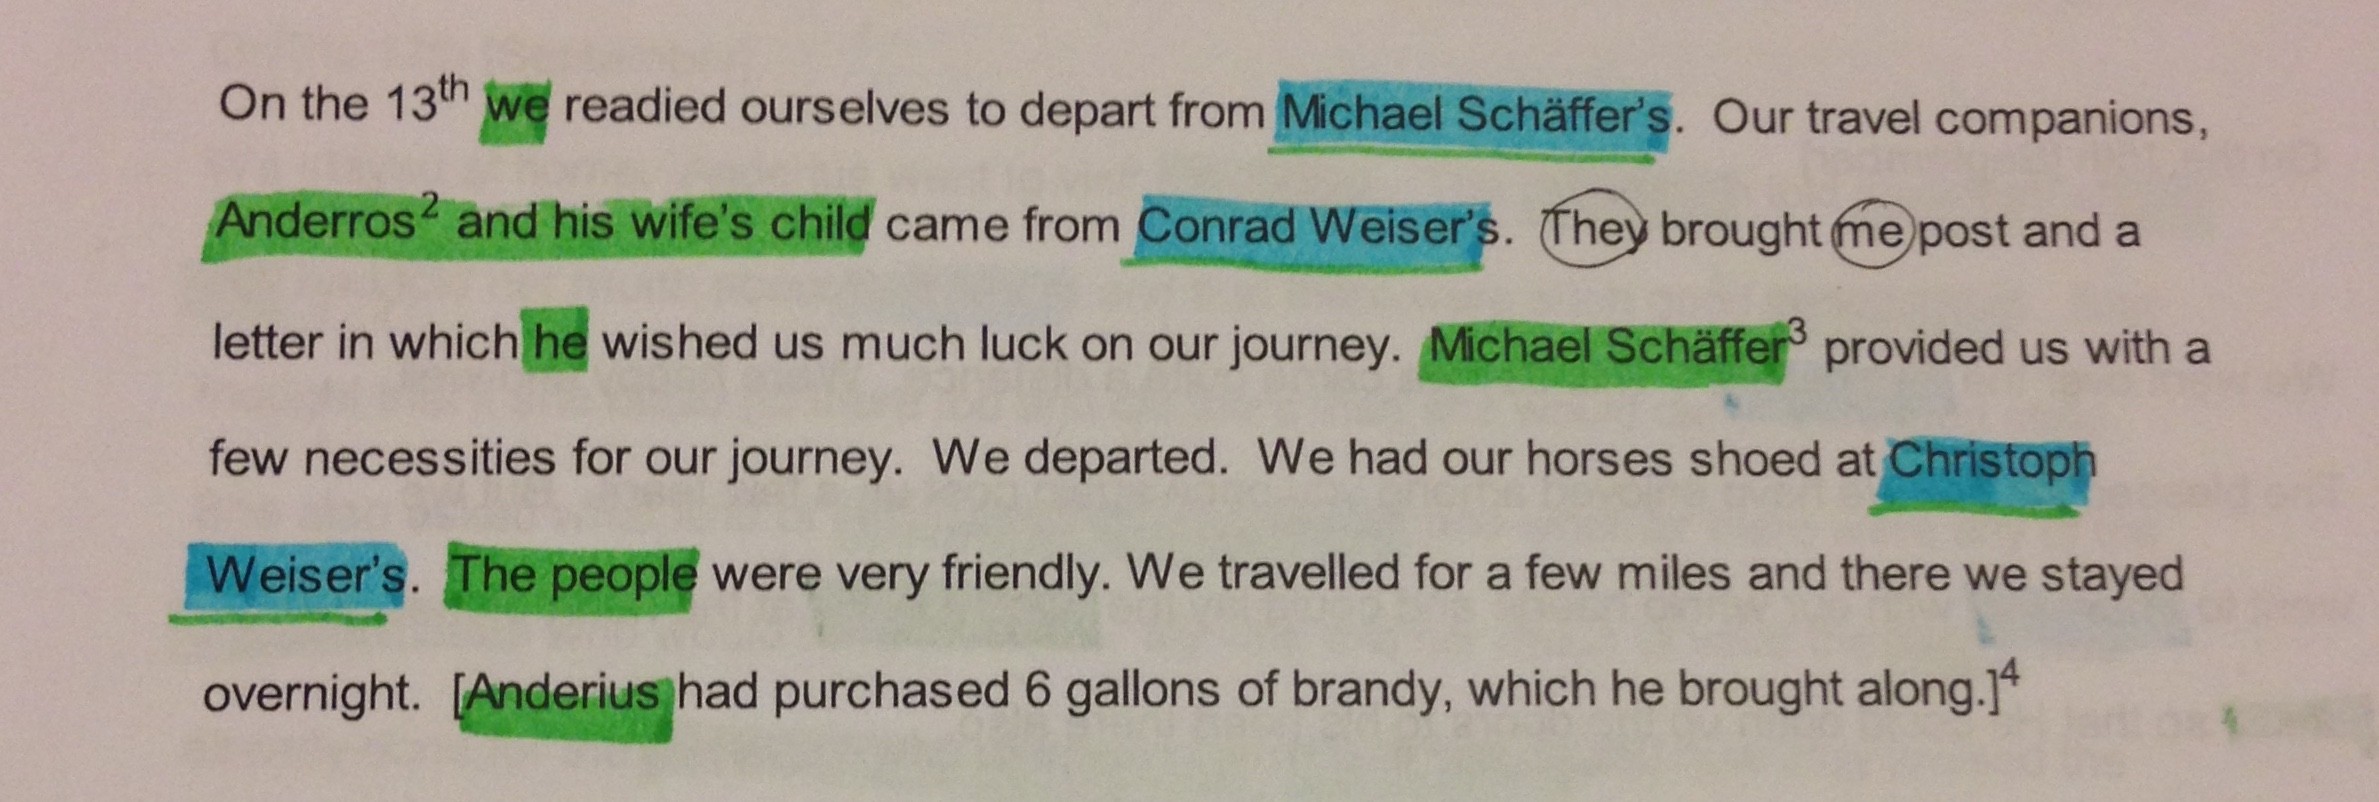
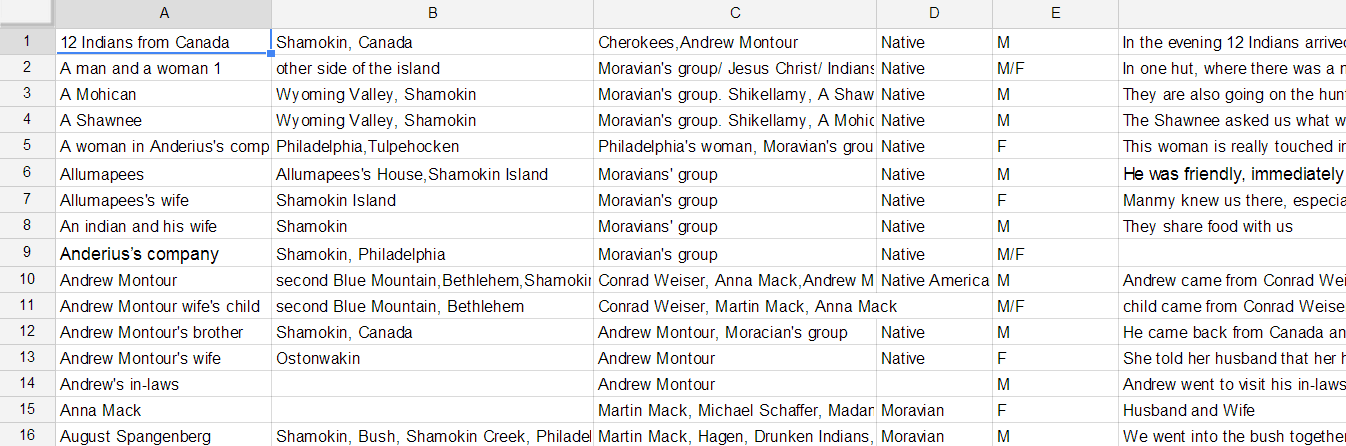
In our lightning talk, Jerry presented our new systematic project design. Different from the traditional project design, which starts from a question and is followed by data collection and data analysis, our own design begins with data collection. At first, we marked up the person’s names and place’s names in the Shamokin Diaries written by Martin Mack and Joseph Powell. Then we turned our marked up data into a prosopography using google spreadsheet. Based on the prosopography, we came up with an interesting question whose answer can be found in our database. Having decided our research topic (the question), we started analyzing our data using Gephi visualization. We examined the differences of the person-person and person-place relationships between Mack’s Diary and Powell’s Diary, believing that those differences had further implications that lead to the answer of our question.
We modified the traditional project design for two reasons. First of all, as the final project of the digital humanities class, our project should reveal at least one digital humanities tool that we had learned to use in class. The first thing we did was deciding which tool we wanted to use. We chose Gephi, a network visualization tool, so it was very clear to us what data we should collect. In another word, because of the tool we chose, we were able to collect our data without deciding our research topic. Moreover, since we had only 28 days to complete our final project, it would be more reasonable to figure out our question based on our data. For projects with more time, researchers can set up a question first and collect data later, because they have time to make different attempts before they reach the answer. For example, scientists usually have a question and a hypothesis at first. They then do experiment to verify the hypothesis. If the result of the experiment contradicts the hypothesis, they can just change another hypothesis and do another experiment. Most scientific theorems are the results of thousands of attempts. However, with only 28 days, we had to know exactly what question our database can answer.
That’s why we changed our question slightly after we collected our data. In our abstract, we stated that we aimed to answer “how the relations between people changed in Shamokin”. Having completed our database, we realized that our data would not generate the answer to this question. Instead, our data presented the person-person and person-place relations among the Moravians and others. Since traveling and preaching are the centers of Moravians work, analyzing the people and the places related to the Moravians would reveal how the life of Moravians changed from Mack’s time (1745) to Powell’s time (1748). Thus, we modified our question. Rather than asking “how the relations between people changed in Shamokin”, we were now interested in “how the life of Moravians in Shamokin changed.”
Besides our new systematic project design, we made another alternation to facilitate our work. When we were creating our prosopography, we were on Thanksgiving break, so we had to work individually. We split the diary half-half, and each person was responsible for collecting the data of one part. In order to maintain consistency, we added a sheet called “rule list” on our Google spreadsheet. For example, since there were lots of “we” in Mack’s Diary, Jerry suggested that we could use “Moravian’s group” to refer Anna and Martin Mack. On the “rule list” sheet, I could say whether I agree or not, and what alternative I had if I disagree. We found that the “rule list” helped a lot when doing collaborative work.
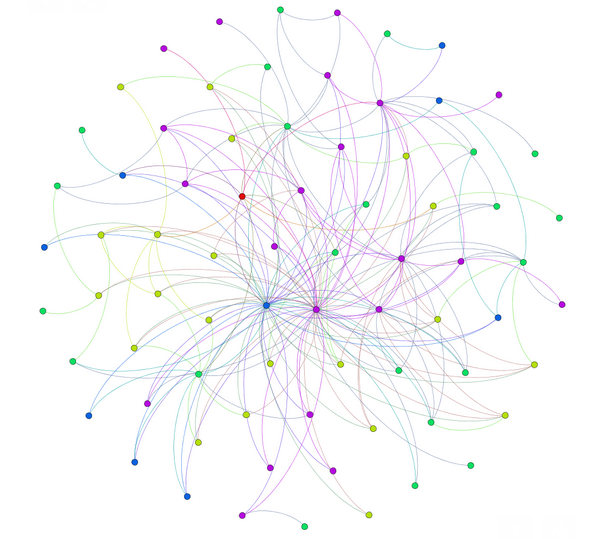
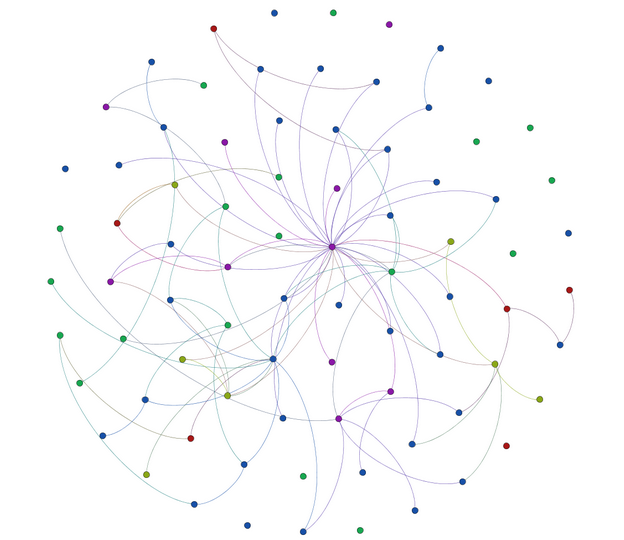
The Gephi visualization showed lots of difference between Powell’s Diary and Mack’s Diary, so the changes of the Moravians’ life from 1745 to 1748 were obvious. For example, Mack was connected to most of the places directly, which meant he visited the places himself. In comparison, Powell was connected to places in a more indirect way. Take Tulpehocken for instance: he was connected to Tulpehocken through Shikellamy, because Shikellamy asked him how far Bethlehem was from Tulpehocken. Moreover, Anna Mack was one of the centers of the Gephi visualization of Mack’s Diary, which meant she was a protagonist of the diary. However, Martha Powell was not even showed in the Gephi visualization of Powell’s Diary. In another word, Powell did not even mention his wife in his diary.
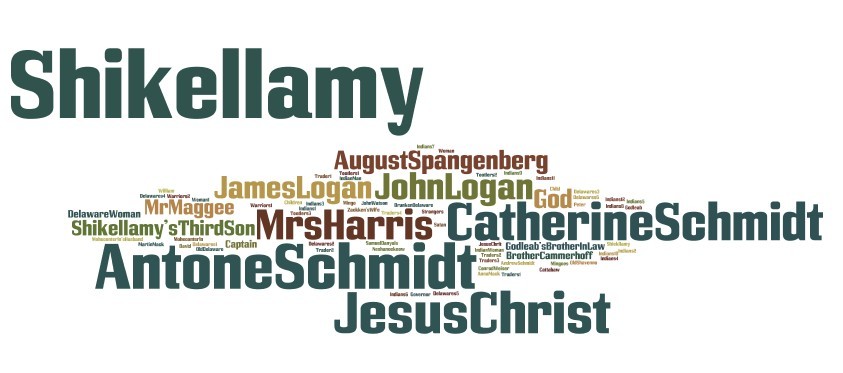
While Gephi visualized the relations among people, it only showed whom knew whom. It did not reveal how close their relations. Thus, I created two Wordle visualizations by inputting all the person names appeared in both diary. The word clouds showed that Jesus Christ was mentioned the most in Mack’s Diary and Powell had a very close relationship with Shikellamy.

Telling the differences between Mack’s Diary and Powell’s Diary was easy, but examining the further implications of these differences was not. At first, we concluded that Powell was not an eligible Moravian: he preferred staying at home than visiting Indians and preaching; he preferred socializing with powerful people such as Shikellamy and the captain of warriors than visiting ordinary people; he prayed to the Lamb much less than Mack did. However, professor Faull reminded us that these differences might due to time difference rather than ideological difference. For instance, the reason why Mack and Shikellamy did not visit each other much could also be that Mack was the first Moravians in Shamokin and the relationship between Moravians and Shikellamy had not been built yet. Similarly, the fact that Martha was not mentioned in Powell’s Diary might be interpreted as that the Powells was not a loving couple, but it could also be because Martha kept her own diary and Joseph need not to record her work. Thus, we should be very careful when drawing a conclusion. It would be very irresponsible to draw conclusions simply based on distant reading.
Though more a question generator than an answer provider, when combined with close reading, our project did partly answer our research question “how the life of Moravians in Shamokin changed”. It would be safe to conclude that Powell led a happier life than Mack. Although Mack wrote “we were deeply contended” for a few times, he felt lonely, “fearful” and “as though something is pressing us down” most of the time. He missed Bethlehem a lot and prayed for Jesus to send some Gemeine to Shamokin. Whenever he wrote about Bethlehem, he used the word “blessing”; whenever he talked about Shamokin, he lamented that the place was still occupied by Satan. At the end of the diary, he referred him and Anna as “two poor souls for the last 9 weeks”. In comparison, Powell did not complain his life in Shamokin much. The Native visited him and brought him food. He was “well in body and spirit” and “well employed”. Rather than sharing a small hut with Madame Montour as Mack did, they had a secure house with garden and living room. Women and children even made his house a refuge.
Looking back at my first blog post, which analyzes the project of “Mapping the Republic of Galileo’s Letter”, I found the project even more inspiring. At the beginning, I thought that bar and pie charts were old-fashioned and not so “digital humanities-ed”. However, having completed my final project which was also about network visualization, I started to appreciate the usefulness of bar and pie charts. I could use bar chart to represent the times that a person appeared in the diaries and use pie chart to represent the ethnic groups of the people connected to Powell or Mack.
At first sight, it seems to me that making Gephi visualization of Mack’s Diary is just a repetition of my previous work of Powell’s Diary’s Gephi visualization. However, I soon realized that it was a brand new project. It demanded creative project design, improved my collaborative skill, provided me insightful information about Moravians’ life and encouraged me to rethink other digital humanities work.